1、Matplotlib库的使用
Matplotlib库由各种可视化类构成,内部结构复杂,受Matlab启发。
matplotlib.pyplot是绘制各类可视化图形的命令子库,相当于快捷方式。通过import matplotlib.pyplot as plt方式引入。
下面作一个Matplotlib库的测试:
1
2
3
4
| import matplotlib.pyplot as plt
plt.plot([3,1,4,5,2])
plt.ylabel("Grade")
plt.show()
|
plt.plot()只有一个输入列表或数组时,参数被当作Y轴,X轴以索引自动生成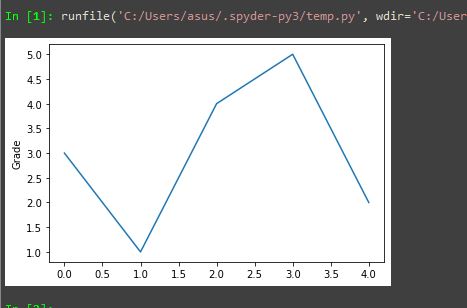
plt.savefig()将输出图形存储为文件,默认PNG格式,可以通过dpi修改输出质量
1
2
3
4
5
| import matplotlib.pyplot as plt
plt.plot([3,1,4,5,2])
plt.savefig('test',dpi=600)
plt.ylabel("Grade")
plt.show()
|
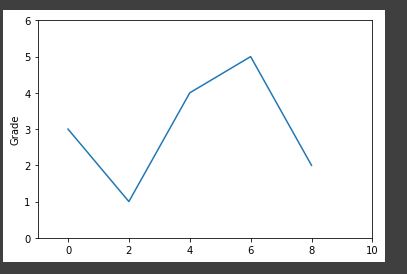
plt.plot(x,y)当有两个以上参数时,按照X轴和Y轴顺序绘制数据点,plt.axis()限定坐标轴起始点
1
2
3
4
5
| import matplotlib.pyplot as plt
plt.plot([0,2,4,6,8],[3,1,4,5,2])
plt.ylabel("Grade")
plt.axis([-1,10,0,6])
plt.show()
|
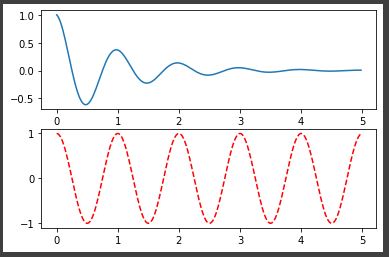
pyplot的绘图区域plt.subplot(nrows, ncols, plot_number)
例:plt.subplot(3,2,4)
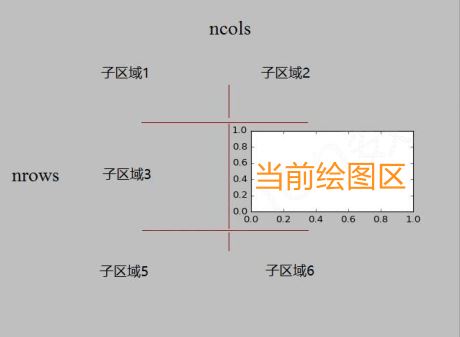
在全局绘图区域中创建一个分区体系,并定位到一个子绘图区域
1
2
3
4
5
6
7
8
9
10
11
12
13
14
| import numpy as np
import matplotlib.pyplot as plt
def f(t):
return np.exp(-t)*np.cos(2*np.pi*t)
a = np.arange(0.0,5.0,0.02)
plt.subplot(211)
plt.plot(a,f(a))
plt.subplot(2,1,2)
plt.plot(a,np.cos(2*np.pi*a),'r--')
plt.show()
|
2、pyplot的plot()函数
plt.plot(x, y, format_string, **kwargs)
● x : X轴数据,列表或数组,可选
● y : Y轴数据,列表或数组
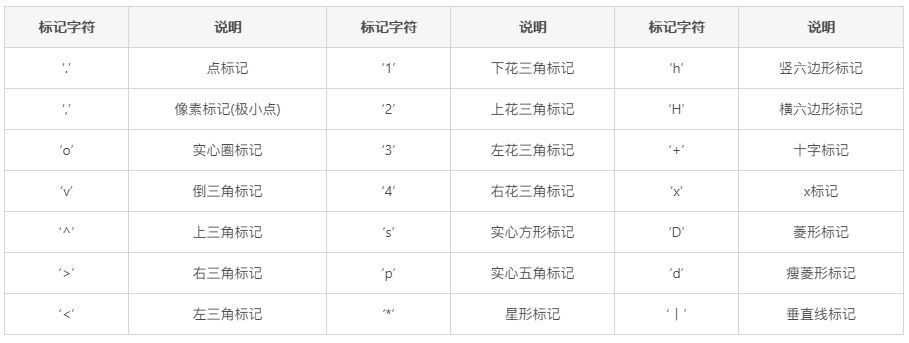
● format_string: 控制曲线的格式字符串,可选。由颜色字符、风格字符和标记字符组成。
| 颜色字符 |
说明 |
颜色字符 |
说明 |
| ‘b’ |
蓝色 |
‘m’ |
洋红色 magenta |
| ‘g’ |
绿色 |
‘y’ |
黄色 |
| ‘r’ |
红色 |
‘k’ |
黑色 |
| ‘c’ |
青绿色 cyan |
‘w’ |
白色 |
| ‘#008000’ |
RGB某颜色 |
‘0.8’ |
灰度值字符串 |
| 风格字符 |
说明 |
| ‘‐’ |
实线 |
| ‘‐‐’ |
破折线 |
| ‘‐.’ |
点划线 |
| ‘:’ |
虚线 |
| ‘’ ‘ ‘ |
无线条 |
1
2
3
4
5
6
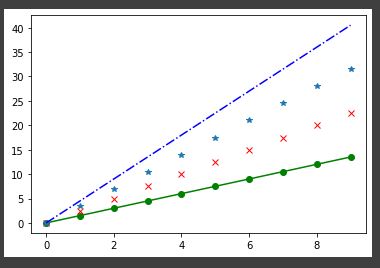
| import numpy as np
import matplotlib.pyplot as plt
a = np.arange(10)
plt.plot(a,a*1.5,'go-',a,a*2.5,'rx',a,a*3.5,'*',a,a*4.5,'b-.')
plt.show()
|
● **kwargs : 第二组或更多(x,y,format_string)
color : 控制颜色, color=’green’
linestyle : 线条风格, linestyle=’dashed’
marker : 标记风格, marker=’o’
markerfacecolor: 标记颜色, markerfacecolor=’blue’
markersize : 标记尺寸, markersize=20
……
当绘制多条曲线时,各条曲线的x不能省略
3、pyplot的中文显示
(一)第一种方法:rcParams
pyplot并不默认支持中文显示,需要rcParams修改字体实现
例:plt.rcParams['font.sans-serif'] = 'SimHei' ,'SimHei'是黑体
| 属性 |
说明 |
| ‘font.family’ |
用于显示字体的名字 |
| ‘font.style’ |
字体风格,正常’normal’或 斜体’italic’ |
| ‘font.size’ |
字体大小,整数字号或者’large’、’x‐small’ |
| 中文字体 |
说明 |
| ‘SimHei’ |
中文黑体 |
| ‘Kaiti’ |
中文楷体 |
| ‘LiSu’ |
中文隶书 |
| ‘FangSong’ |
中文仿宋 |
| ‘YouYuan’ |
中文幼圆 |
| ‘STSong’ |
华文宋体 |
1
2
3
4
5
6
7
8
9
10
11
12
13
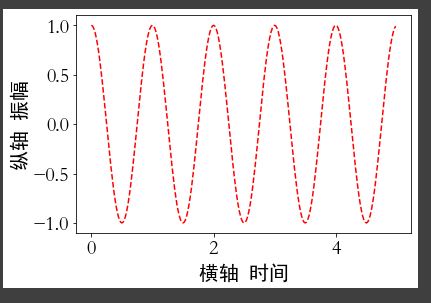
| import numpy as np
import matplotlib.pyplot as plt
import matplotlib
matplotlib.rcParams['font.family']='STSong'
matplotlib.rcParams['font.size']=20
a = np.arange(0.0,5.0,0.02)
plt.xlabel('横轴 时间')
plt.ylabel('纵轴 振幅')
plt.plot(a,np.cos(2*np.pi*a),'r--')
plt.show()
|
(二)第二种方法:fontproperties
在有中文输出的地方,增加一个属性:fontproperties
1
2
3
4
5
6
7
8
9
| import numpy as np
import matplotlib.pyplot as plt
a = np.arange(0.0,5.0,0.02)
plt.xlabel('横轴 时间',fontproperties="SimHei",fontsize=20)
plt.ylabel('纵轴 振幅',fontproperties="SimHei",fontsize=20)
plt.plot(a,np.cos(2*np.pi*a),'r--')
plt.show()
|
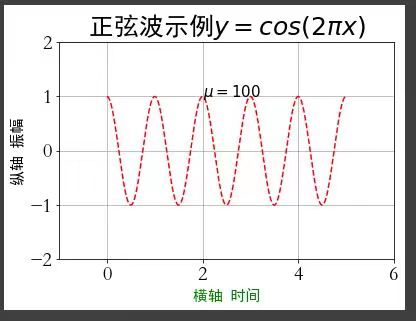
4、pyplot的文本显示
pyplot的文本显示包含以下函数:

1
2
3
4
5
6
7
8
9
10
11
12
13
14
| import numpy as np
import matplotlib.pyplot as plt
a = np.arange(0.0,5.0,0.02)
plt.plot(a,np.cos(2*np.pi*a),'r--')
plt.xlabel('横轴 时间',fontproperties="SimHei",fontsize=15,color="green")
plt.ylabel('纵轴 振幅',fontproperties="SimHei",fontsize=15)
plt.title(r'正弦波示例$y=cos(2\pi x)$',fontproperties="SimHei",fontsize=25)
plt.text(2,1,r'$\mu=100$',fontsize=15)
plt.axis([-1,6,-2,2])
plt.grid(True)
plt.show()
|
$y=cos(2\pi x)$为Latex排版
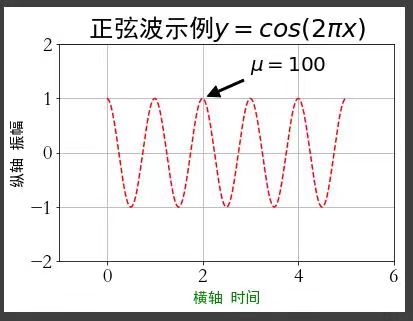
plt.annotate(s, xy=arrow_crd, xytext=text_crd, arrowprops=dict)带箭头示例:
1
2
3
4
5
6
7
8
9
10
11
12
13
14
15
| import numpy as np
import matplotlib.pyplot as plt
a = np.arange(0.0,5.0,0.02)
plt.plot(a,np.cos(2*np.pi*a),'r--')
plt.xlabel('横轴 时间',fontproperties="SimHei",fontsize=15,color="green")
plt.ylabel('纵轴 振幅',fontproperties="SimHei",fontsize=15)
plt.title(r'正弦波示例$y=cos(2\pi x)$',fontproperties="SimHei",fontsize=25)
plt.annotate(r'$\mu=100$',xy=(2,1),xytext=(3,1.5),
arrowprops=dict(facecolor='black',shrink=0.1,width=2))
plt.axis([-1,6,-2,2])
plt.grid(True)
plt.show()
|
5、pyplot子绘图区域
(一)复杂的绘图区域
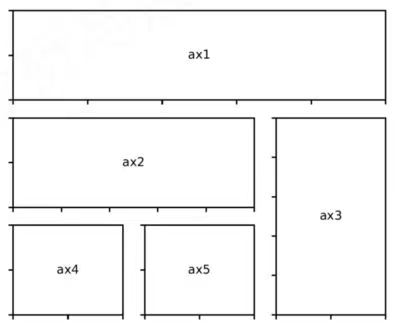
plt.subplot2grid(GridSpec, CurSpec, colspan=1, rowspan=1), 理念:设定网格,选中网格,确定选中行列区域数量,编号从0开始
1
2
3
4
5
| plt.subplot2grid((3,3), (0,0), colspan=3)
plt.subplot2grid((3,3), (1,0), colspan=2)
plt.subplot2grid((3,3), (1,2), colspan=2)
plt.subplot2grid((3,3), (2,0))
plt.subplot2grid((3,3), (2,1))
|
(二)GridSpac类
1
2
3
4
5
6
7
8
| import matplotlib.gridspec as gridspec
gs = gridspec.GridSpec(3,3)
ax1 = plt.subplot(gs[0,:])
ax2 = plt.subplot(gs[1,:-1])
ax3 = plt.subplot(gs[1:,-1])
ax4 = plt.subplot(gs[2,0])
ax5 = plt.subplot(gs[2,1])
|
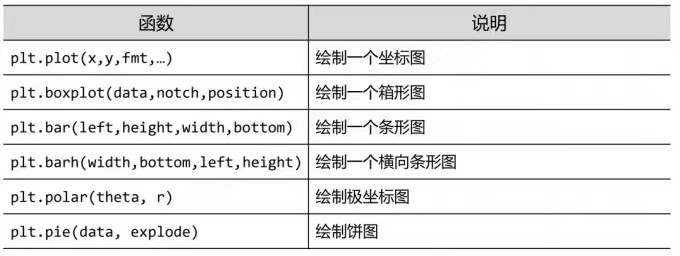
6、pyplot基础图表函数

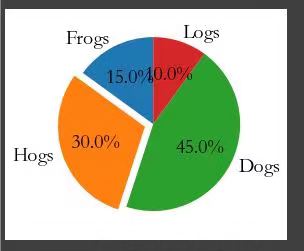
(一)pyplot饼图的绘制plt.pie()
1
2
3
4
5
6
7
8
9
10
11
| import matplotlib.pyplot as plt
labels = 'Frogs','Hogs','Dogs','Logs'
sizes = [15,30,45,10]
explode = (0,0.1,0,0)
plt.pie(sizes,explode=explode,labels=labels,autopct='%1.1f%%',
shadow=False,startangle=90)
plt.axis('equal')
plt.show()
|
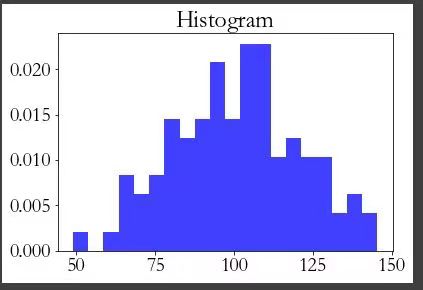
(二)pyplot直方图的绘制plt.hist()
1
2
3
4
5
6
7
8
9
10
| import numpy as ap
import matplotlib.pyplot as plt
np.random.seed(0)
mu,sigma = 100,20
a = np.random.normal(mu,sigma,size=100)
plt.hist(a,20,normed=1,histtype='stepfilled',facecolor='b',alpha=0.75)
plt.title("Histogram")
plt.show()
|
plt.hist(x,bins,normed), bins值得是直方图的个数,normed为1时表示出现的概率,若为0表示元素出现的个数。
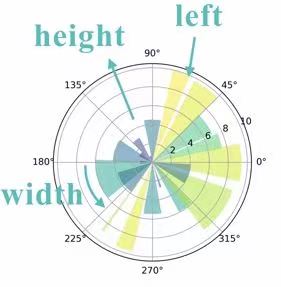
(三)pyplot极坐标图的绘制
采用面向对象绘制极坐标:
1
2
3
4
5
6
7
8
9
10
11
12
13
14
15
16
| import numpy as ap
import matplotlib.pyplot as plt
N = 20
theta = np.linspace(0.0,2*np.pi,N,endpoint=False)
radii = 10 *np.random.rand(N)
width = np.pi/4*np.random.rand(N)
ax = plt.subplot(111,projection='polar')
bars = ax.bar(theta,radii,width=width,bottom=0.0)
for r,bar in zip(radii,bars):
bar.set_facecolor(plt.cm.viridis(r/10.))
bar.set_alpha(0.5)
plt.show()
|
theta表示left(开始的位置),radii表示height(中心点向边缘绘制的长度),width表示每一个绘图区域面积,是个弧度制的值。
(四)pyplot散点的绘制
1
2
3
4
5
6
7
8
| import numpy as ap
import matplotlib.pyplot as plt
fig,ax = plt.subplots()
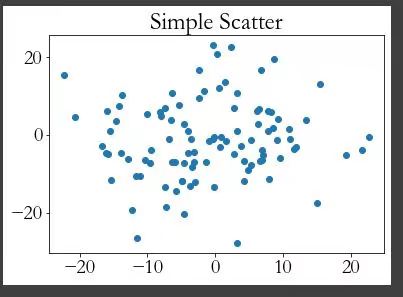
ax.plot(10*np.random.randn(100),10*np.random.randn(100),'o')
ax.set_title('Simple Scatter')
plt.show()
|
